
One might argue that there is a difference in playing cultures between the Hemispheres as we are continually bombarded with commentary that there is. People say the Northern Hemisphere (NH) has the pressure of relegation in the game whereas Super Rugby doesn’t. People comment that the Southern Hemisphere (SH) is played at the right time of year with firm grounds and the sun on the backs of the players. People mention that the NH is more of a set-piece dominated game whereas below the equator it’s more of an attacking counter attack style. There’s also calls for the winners of the European Champions Cup to play the winners of the Super Rugby competition to crown which Hemisphere is the best.
With the 2019 Rugby World Cup on the horizon, and many teams from both Hemispheres being tipped to win the competition, this is another great opportunity to answer the question to put this debate to bed. England, Wales and Ireland are favourites for the NH and New Zealand, South Africa and Australia for the SH. So which hemisphere will take home the William Webb Ellis Cup…?
But when broken down into objective data is this there a difference between the Hemispheres…?!
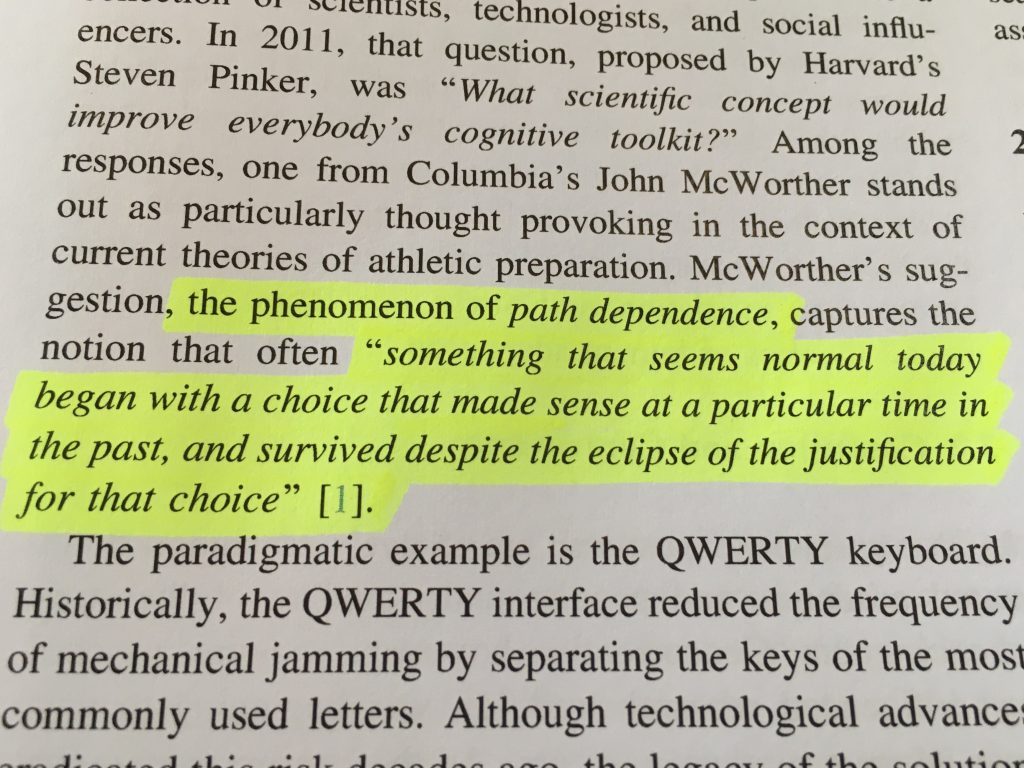
Or is it just the fact that the obvious external factors are different which gives people this assumption that there is a difference between the Hemispheres and that a ‘Path of Dependence’ has grappled this from the outset.
“…something that seems normal today began with a choice that made sense at a particular time in the past, and survived despite the eclipse of the justification for the choice.”
p.2, Periodization Theory: Confronting and Inconvenient Truth, John Kiely, 2017
As part of my ongoing Try Scoring Trends Research Project, inspired by the ex-All Blacks coach Wayne Smith when he did a presentation in Oxford, UK back in October 2012, this is one of the questions that I continue to investigate by collecting and analysing the Try Scoring Trends of different competitions between Clubs and Countries.
For most coaches and analysts in the professional game this objective data won’t be new news, but I delve deeper into the reasons why tries are scored and conceded adding another layer to the Try Scoring Trends. This bridges the gap from the Science of the data to the Art of coaching on the field, thus informing the Practice Design of coaching sessions.
I look in the the ‘Area of the Field’ where tries are scored from, the ‘Possession Platform’ where they are started from, the ‘Number of Rucks’ and the ‘Number of Passes’ it takes to score a try, the ‘Principles of Attack’ to score a try and then the ‘Principles of Defence’ as to why the try was conceded.
For the purposes of answering the question, for this article I compare between Countries and use data from the 2013, 2014, 2015, 2016, 2017 and 2018 seasons respectively. For the SH I use the tries scored in The Rugby Championship where Argentina, Australia, New Zealand and South Africa compete. For the NH I use the tries scored in the 6 Nations Championships where England, France, Ireland, Italy, Scotland and Wales play against each other.
So here are the objective sets of data…
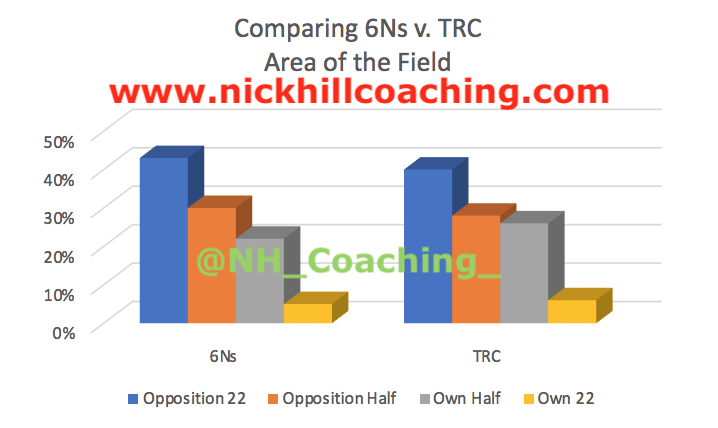
Area of the Field
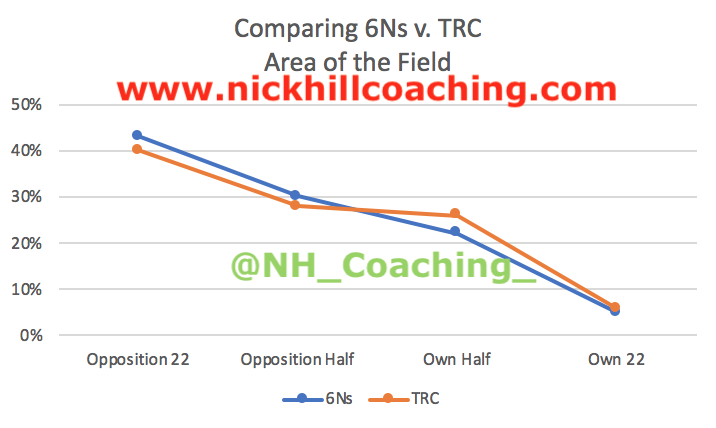
The data shows that most tries are scored starting in the Opposition’s 22m area and the Opposition’s Half, with the least amount of tries being scored starting from within your Own 22m area. Overall the trends for both Hemispheres are very similar, with only slight differences in different areas between them. The Northern Hemisphere (NH) score more tries in the Opposition 22m and Opposition Half and the Southern Hemisphere (SH) score more tries in the Own Half. These findings play in to the hands of what the commentators say with the Set Piece dominated play in the NH and the Counter Attacking play in the SH. Scoring from your Own 22 is the same for both Hemispheres.
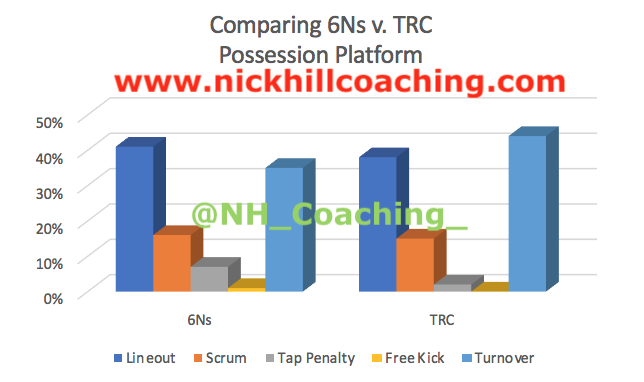
Possession Platform
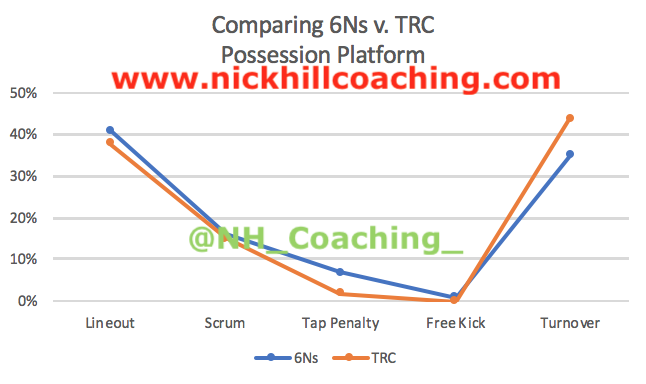
The data shows the same basic trend but the Southern Hemisphere score more tries from Turnover and the Northern Hemisphere score more tries from Lineouts and Scrums. This again backs up what the commentators say about each Hemisphere. Overall, 40% of tries are scored from Lineouts and Turnovers respectively. Throughout the The Rugby Championships 44% of tries are scored from Turnovers and throughout the 6 Nations Tournament 41% of tries are scored from Lineouts.
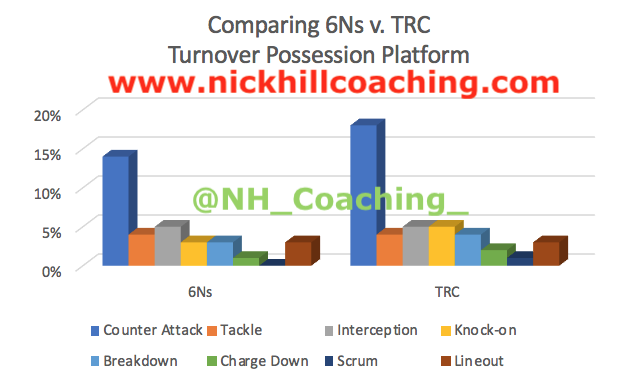
Turnover Possession Platform
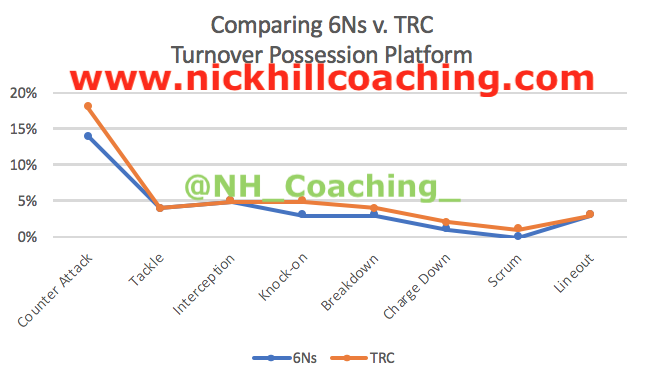
Again the data shows the same basic trend for both Hemispheres but the Southern Hemisphere scores more tries from Counter Attacks, which again backs up what the commentators keep saying that the game down under is more attacking. Overall, 18% and 14% of tries are scored from Counter Attacks respectively.
Number of Rucks per Try
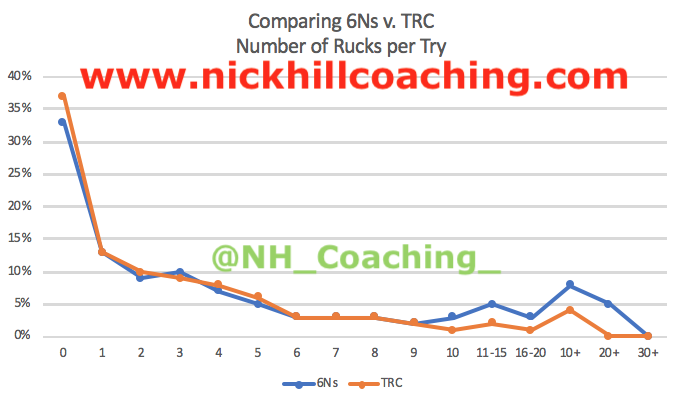
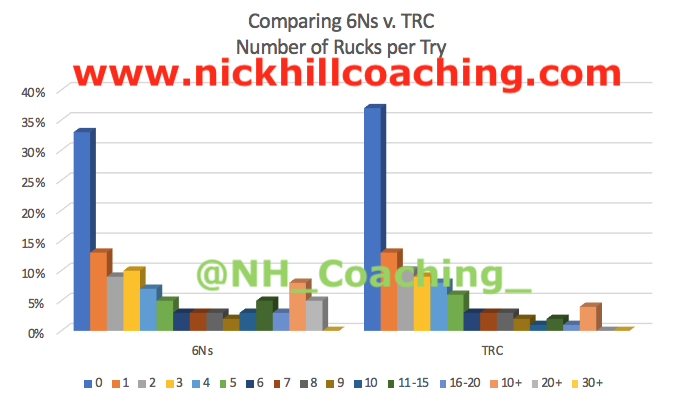
The data shows that the Southern Hemisphere (SH) score more tries in less Rucks. The SH average 2.5 Rucks per Try and the Northern Hemisphere (NH) average 3.6 Rucks per Try. This means that the SH takes one less Ruck per Try to score. The NH have many more tries scored with 10 or more Rucks highlighting their inefficiency of scoring Tries. Overall, the trend between the Hemispheres is basically the same.
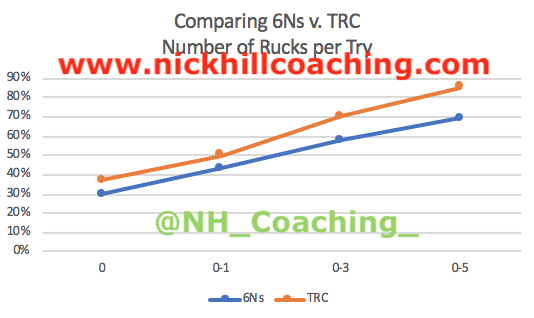
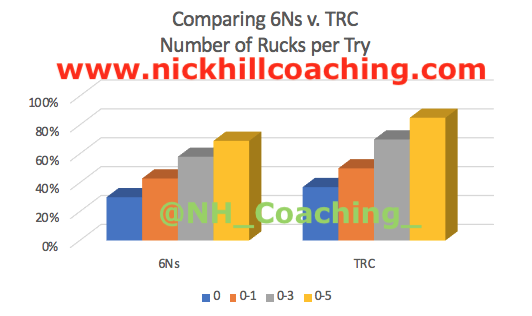
When grouped together, there are clear differences between the Hemispheres: 85% of tries are scored with 5 Rucks or less for the SH (16% more than the NH), 70% of tries are scored with 3 Rucks or less for the SH (12% more than the NH), 50% of tries are scored with 1 Ruck or less for the SH (7% more than the NH) and 37% of tries are scored with 0 Rucks for the SH (7% more than the NH). Thus a significant counter argument to the commentators and pundits who say that you should build the phases to score tries. This puts this myth to bed. The data says that the more Rucks you have, the less chance you will have of scoring.
Number of Rucks per Possession Platform
| No. of Rucks per Possession Platform | ||
| Hemisphere | NH 6Ns Ave. | SH TRC Ave. |
| Lineout | 3.8 | 3.3 |
| Scrum | 3.3 | 1.5 |
| Tap Penalty | 1.8 | 2.0 |
| Free Kick | 4.0 | 2.0 |
| Turnover | 3.9 | 2.6 |
This table shows that the Southern Hemisphere (SH) are far more efficient in scoring Tries from Scrums and Turnovers. And if you round up and down the Lineouts then the SH take one less Ruck to score than the Northern Hemisphere.
| No. of Rucks per T/O Possession Platform | ||
| Hemisphere | NH 6Ns Ave. | SH TRC Ave. |
| Counter Attack | 5.1 | 3.5 |
| Tackle | 5.25 | 0.9 |
| Interception | 1.3 | 0.8 |
| Knock-on | 2.2 | 2.5 |
| Breakdown | 2.8 | 3.3 |
| Charge Down | 3.25 | 0.1 |
| Scrum | – | 1.6 |
| Lineout | 4.3 | 2.6 |
When you break down how the Turnover Tries are scored, there is clear evidence that the SH is better than the NH at scoring Tries from Turnovers. The SH takes 1.6 less Rucks per Try than the NH from Counter Attacks, 4.4 less Rucks from Turnover Tackles, and 1.7 less Rucks from Turnover Lineouts.
Number of Passes per Try
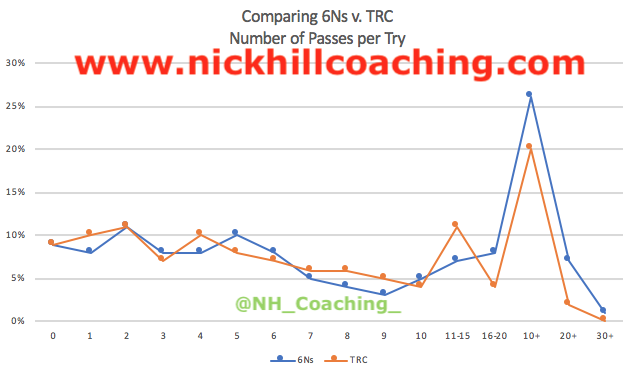
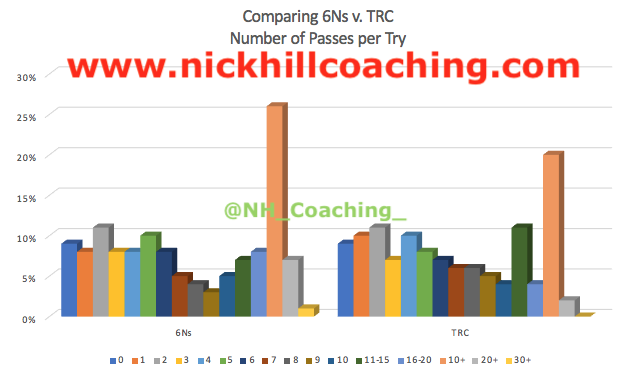
The data shows that the Southern Hemisphere (SH) score more tries in less Passes. The SH average 6.1 Passes per Try and the Northern Hemisphere (NH) average 7.4 Passes per Try, thus the SH take one less Pass per Try to score. At 10 or more Passes per Try, the NH has 26% of tries compared to 20% for the SH, and with 20+ or more passes the NH has more again. At 11-15 Passes per Try, the SH has 11% compared to 7% for the NH.
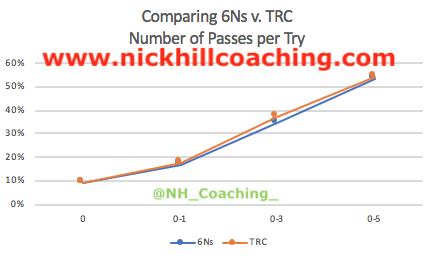
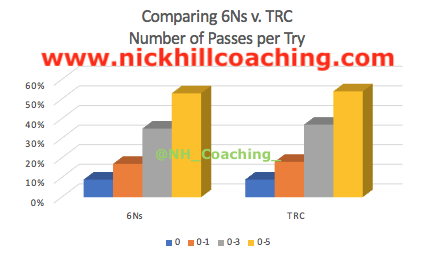
When grouped together there is no real difference between 0 Passes, 0-1 Passes, 0-3 Passes, and 0-5 Passes. Just over 50% of all Tries are scored with 0-5 Passes. Overall, the trends of the two Hemispheres are basically the same.
Number of Passes per Possession Platform
| No. of Passes per Possession Platform | ||
| Hemisphere | NH 6Ns Ave. | SH TRC Ave. |
| Lineout | 7.3 | 6.8 |
| Scrum | 6.9 | 3.8 |
| Tap Penalty | 4.1 | 6.1 |
| Free Kick | 10.75 | 4.5 |
| Turnover | 8.4 | 6.4 |
The key differences are Tries scored from Scrums and Turnovers, where the Southern Hemisphere (SH) takes less passes to score Tries. The SH take 3 less Passes to score from Scrums and 2 less Passes to score from Turnovers. Clear evidence that the SH is more efficient at scoring Tries than the Northern Hemisphere (NH).
| No. of Passes per Turnover Platform | ||
| Hemisphere | NH 6Ns Ave. | SH TRC Ave. |
| Counter Attack | 11.1 | 8.5 |
| Tackle | 10.4 | 4.75 |
| Interception | 3.3 | 2.5 |
| Knock-on | 4.7 | 6.4 |
| Breakdown | 4.7 | 7.0 |
| Charge Down | 6.5 | 1.25 |
| Scrum | – | 4.0 |
| Lineout | 10.2 | 6.1 |
When you break down how the Turnover Tries are scored, there is clear evidence that the SH is better than the NH at scoring Tries from Turnovers. The SH takes 2.6 less Passes per Try than the NH from Counter Attacks, 5.7 less Passes from Turnover Tackles, and 4.1 less Passes from Turnover Lineouts. The NH takes 1.7 less Passes per Try than the SH from Knock-ons, and 2.3 less Passes from Breakdowns.
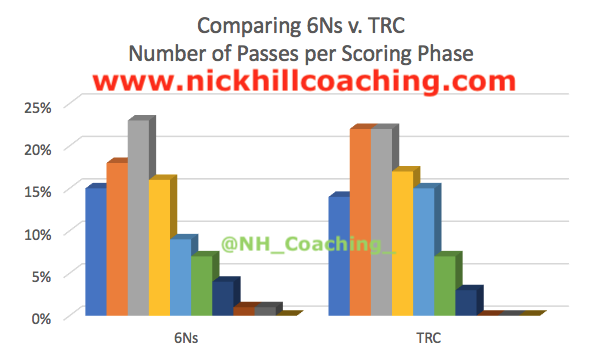
Number of Passes per Scoring Phase
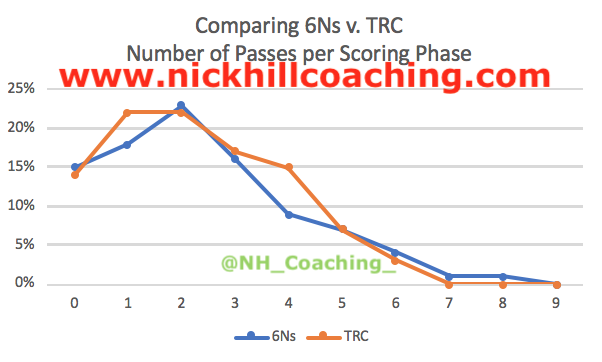
The data shows that the trends for both Hemispheres are very similar with all scoring phases basically being completed with no more than 5 passes, with 90% of tries having 5 passes or less.
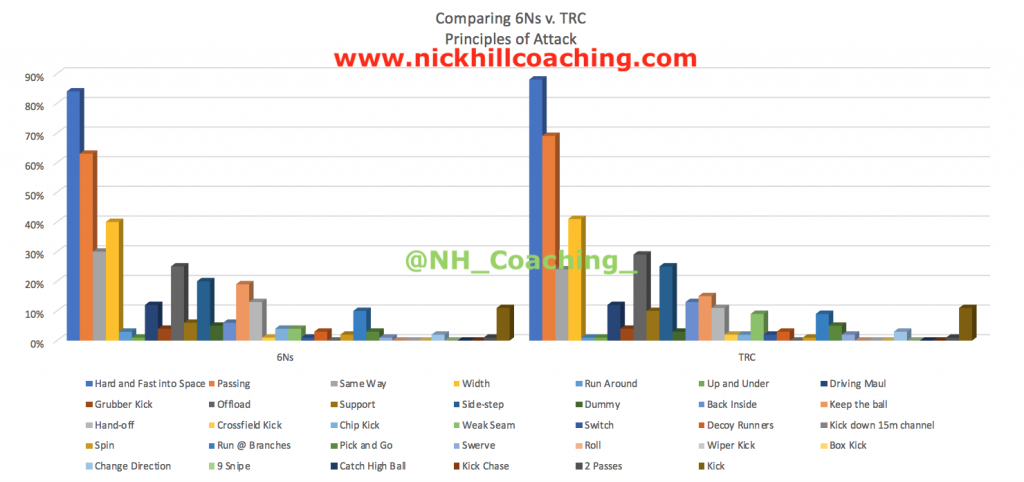
Principles of Attack
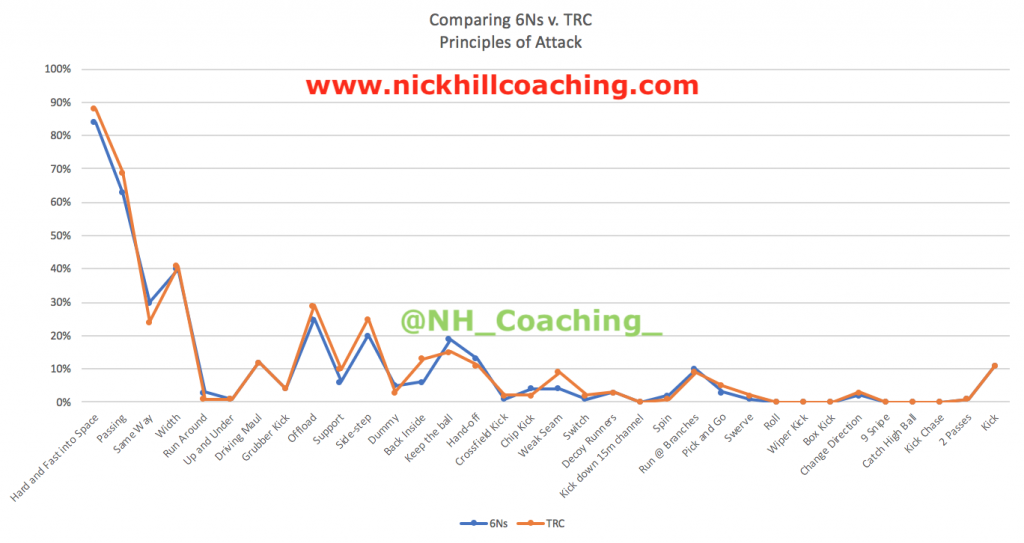
Overall there are very similar trends between both Hemispheres, with the key overall Principles of Attack being ‘Hard and Fast into Space’, use Passing, go the Same Way, have Width, Offload out of the tackle, Side-step defenders, and Hand-off a tackler.
The data shows there are differences for the SH in…
- Passing
- Support
- Offload
- Side-step
- Weak Seam
- Back Inside
The data shows there are differences for the NH in…
- Same Way
- Keep the ball
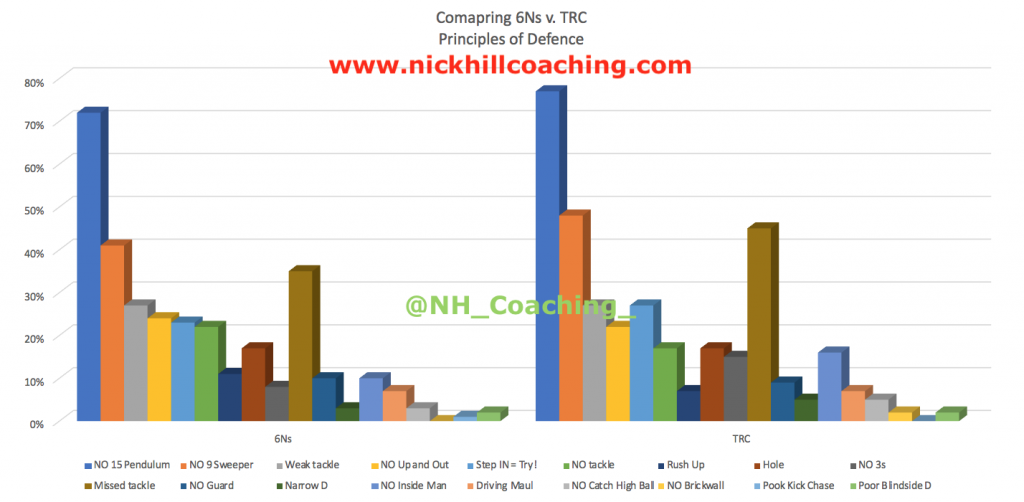
Principles of Defence

Overall there are very similar trends between both Hemispheres, with the key overall Principles of Defence being ‘NO Back 3 Pendulum, ‘NO 9 Sweeper’, Missed tackle, Weak tackle, ‘NO Up and Out’, ‘Step IN = Try!’, having a Hole in the Brickwall, and having ‘NO Inside Man’.
The data shows there are differences for the SH in…
- NO Back 3 Pendulum
- NO 9 Sweeper
- Step IN = Try!
- NO 3s
- Missed tackles
- NO Inside Man
The data shows there are differences for the NH in…
- NO tackle
Conclusion
| Try Scoring Trend | Is there a significant difference between the Hemispheres…?! |
| Area of the Field | NO |
| Possession Platform | YES |
| Turnover Possession Platform | YES |
| Number of Rucks | YES |
| Number of Rucks per Possession Platform | YES |
| No. of Rucks per Turnover Possession Platform | YES |
| Number of Passes | YES |
| No. of Passes per Possession Platform | YES |
| Number of Passes per Turnover Possession Platform | YES |
| Number of Passes per Scoring Phase | NO |
| Principles of Attack | NO |
| Principles of Defence | NO |
So looking at the table above, in general there is not really a difference between the Hemispheres in relation to where tries are scored on the field from, the Principles of Attack that score the tries and the Principles of Defence that concede the tries.
But where there is a difference between the Hemispheres, it is in relation to the Possession Platform, mainly Turnovers, the Turnover Possession Platform in particular Counter Attacks, the Number of Rucks and the Number of Passes it takes to score a try.
Is there a significant difference between the Hemispheres…?! YES AND NO
Thoughts
Zooming out and looking across the different pieces of objective data, the observations and conclusions offer more questions than answers. There are 3 factors (Area of Field, Principles of Attack and Principles of Defence) that show the same trends, and a 4th factor (Possession Platform) as well where the trends are the same but the Southern Hemisphere (SH) score more tries from Turnovers. This falls in line with the fact, for me, that the game is based on principles as Rugby Union falls under the guidance of an Invasion Game, which comes under the Teaching Games for Understanding umbrella.
There’s a few other pieces of information that we should look at as well as I believe that they do share more light into the differences between the Hemispheres.
Overall Average Number of Tries per Match
| Hemisphere | Tries | Matches | Tries per Match |
| Northern | 375 | 90 | 4.2 |
| Southern | 400 | 68 | 5.9 |
This table shows the biggest evidence that there is a clear difference between the Hemispheres. The SH score more tries per match, basically 2 more per match, than the Northern Hemisphere which sees their matches have more points per match as well. It’s also important to note that the SH score their more tries in less matches, a very intriguing stat to emphasise.
Overall Average Number of Points per Match
| Hemisphere | Points | Matches | Points per Match |
| Northern | 3825 | 90 | 42.5 |
| Southern | 3525 | 68 | 51.8 |
Overall Correlation between scoring tries and winning the match
| Hemisphere | +ve | Zero | -ve |
| Northern | 73% | 19% | 8% |
| Southern | 73% | 18% | 6% |
The overall correlation data shows a very positive correlation between the try difference and whether or not you win the game.
- +ve = Scored more tries than the opposition and won the game
- Zero = Scored the same number of tries as the opposition and won the game
- -ve = Scored less tries than the opposition and won the game
As you can see, this objective data clearly shows there is not a difference between the Hemispheres. This is more evidence to back up that the game is the same all around the world. This highlights what the objective of the game of the Rugby Union is about, when looking through the lens of it being an Invasion Game, scoring tries in attack and stopping tries in defence. And if you do that then you will win the game.
NB
This is a bigger set of data over a number of years, 2013 to 2018, compared to the Clubs example I shared last week. This is a very valid set of data as it tracks 10 teams consecutively who play against each other each season in their respective competitions (the 6 Nations and The Rugby Championship) at the same time of year, every year.
I’ll continue to add to the Clubs’ data set as I have done and do different projects with Super Rugby, the Gallagher Premiership, the Top 14 and the PRO 14.
Then with the 2019 Rugby World Cup right around the corner, it will be intriguing to analyse all the tries throughout the Tournament, collate the evidence, and then analyse the data to see if anything changes when the pressure of the biggest competition in rugby is at play. I will also then be able to add the 2015 Rugby World Cup data to this comparison to expand the evidence.
So in the future I’ll continue to collect a larger data set to add weight to the debate between the Hemispheres, and come to a more conclusive answer as to whether there actually is a difference between the Hemispheres, or it is in actual fact just a myth that has taken a “Path of Dependence”.