
One might argue that there is a difference in playing cultures between the Hemispheres as we are continually bombarded with commentary that there is. People say the Northern Hemisphere has the pressure of relegation in the game whereas Super Rugby doesn’t. People comment that the Southern Hemisphere is played at the right time of year with firm grounds and the sun on the backs of the players. People mention that the Northern Hemisphere is more of a set-piece dominated game whereas below the equator it’s more of an attacking counter attack style. There’s also calls for the winners of the European Champions Cup to play the winners of the Super Rugby competition to put this debate to bed and confirm which Hemisphere is the best.
But when broken down into objective data is this there a difference between the Hemispheres…?!
Or is it just the fact that the obvious external factors are different which gives people this assumption that there is a difference between the Hemispheres and that a ‘Path of Dependence’ has grappled this from the outset.
“…something that seems normal today began with a choice that made sense at a particular time in the past, and survived despite the eclipse of the justification for the choice.”
p.2, Periodization Theory: Confronting and Inconvenient Truth, John Kiely, 2017
So, for me, the closest you could get to the Hemispheres having the “same” pressure of winning is during the knock-outs stages of the respective competitions so that you can compare as close as possible like for like, rather than apples and oranges.
As part of my ongoing Try Scoring Trends Research Project, inspired by the ex-All Blacks coach Wayne Smith when he did a presentation in Oxford, UK back in October 2012, this is one of the questions that I have investigated by collecting and analysing the Try Scoring Trends data over the last few years between the hemispheres in the knock-out stages of their respective competitions.
For most coaches and analysts in the professional game this objective data won’t be new news, but I delve deeper into the reasons why tries are scored and conceded adding another layer to the Try Scoring Trends. This bridges the gap from the Science of the data to the Art of coaching on the field, thus informing the Practice Design of coaching sessions.
I look in the the ‘Area of the Field’ where tries are scored from, the ‘Possession Platform’ where they are started from, the ‘Number of Rucks’ and the ‘Number of Passes’ it takes to score a try, the ‘Principles of Attack’ to score a try and then the ‘Principles of Defence’ as to why the try was conceded.
For the purposes of answering the question, I use tries from the 2016, 2017 and 2018 seasons respectively. For the Southern Hemisphere I mainly use the Super Rugby knock-out stages and for the Northern Hemisphere I use the European Champions Cup knock-out stages from the quarter-finals onwards, and then the English Premiership, PRO 14 and TOP 14 Playoffs respectively.
So here are the objective sets of data…
Area of the Field
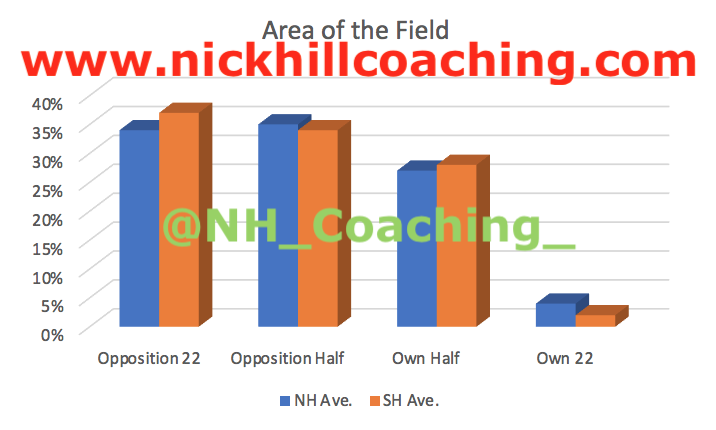
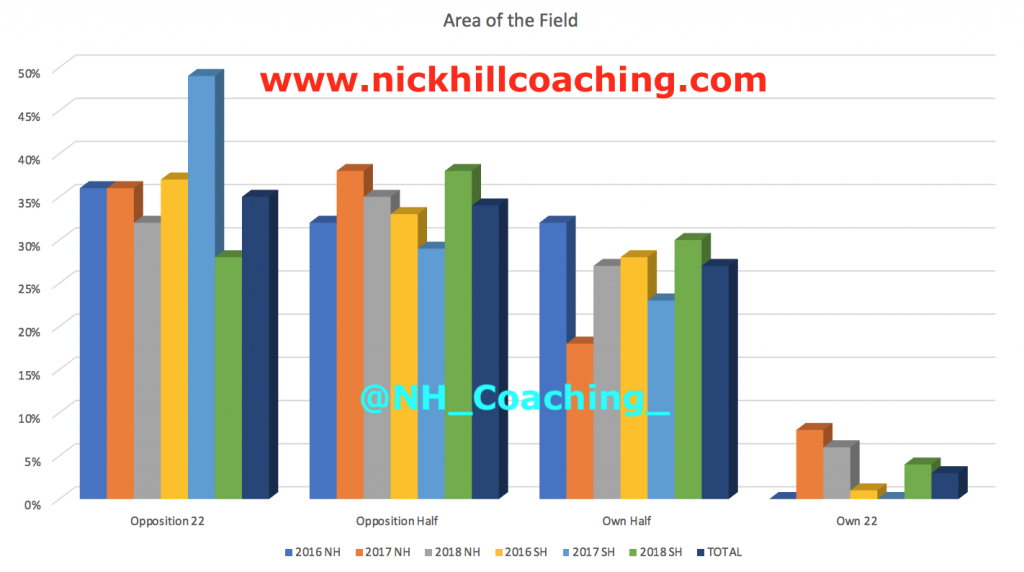
The data shows that most tries are scored starting in the Opposition’s 22m area and the Opposition’s Half, with the least amount of tries being scored starting from within the Own 22m area. Overall tries scored are spread throughout three quarters of the field and the trends for both Hemispheres are very similar, with only slight differences in different areas between them.
Possession Platform
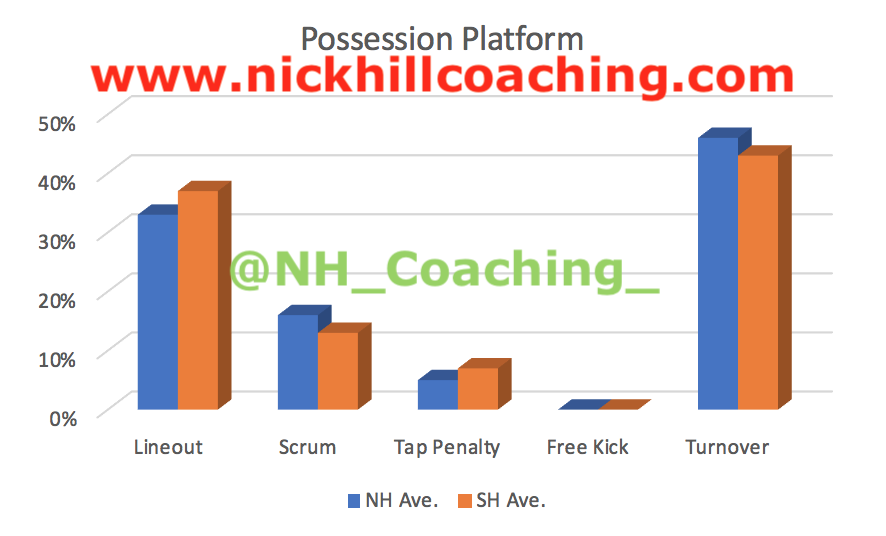
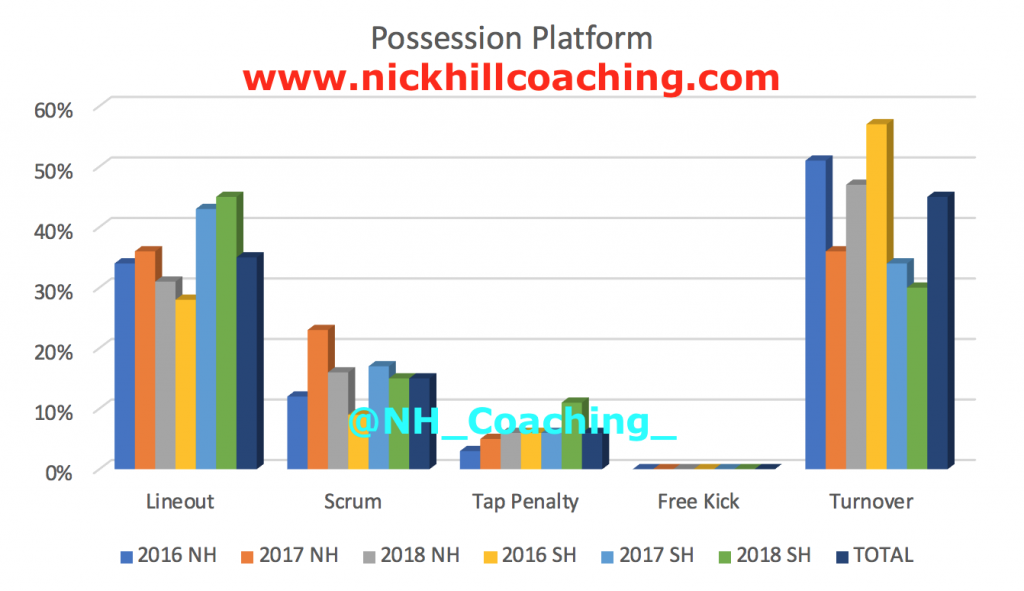
The data shows that the Southern Hemisphere score more tries from Lineouts and Tap Penalties and the Northern Hemisphere score more tries from Scrums and Turnovers. There were no tries scored from Free kicks. Overall, 35% of tries are scored from Lineouts and 45%, nearly half, of tries are scored from Turnovers and the trends for both Hemispheres are very similar.
Turnover Possession Platform
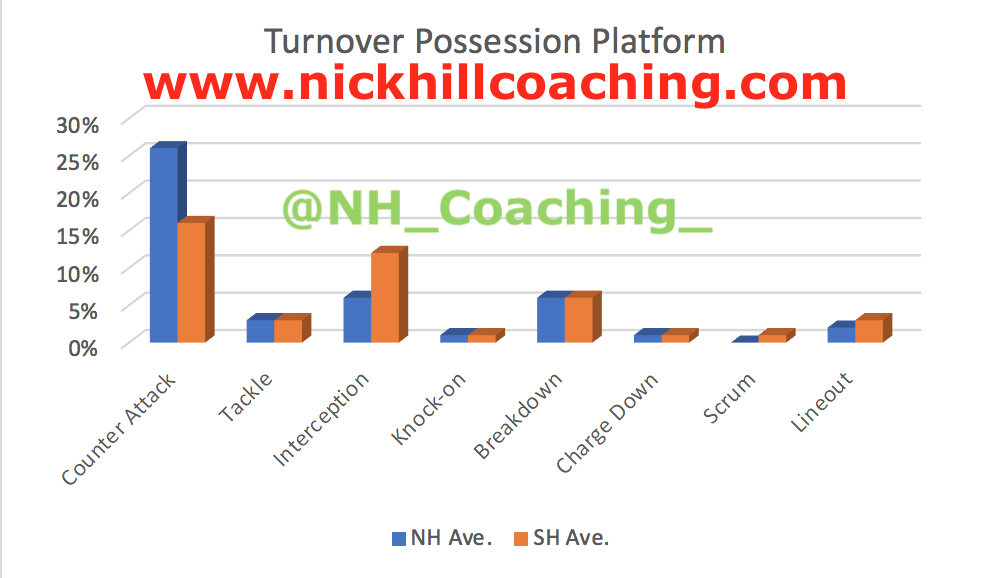
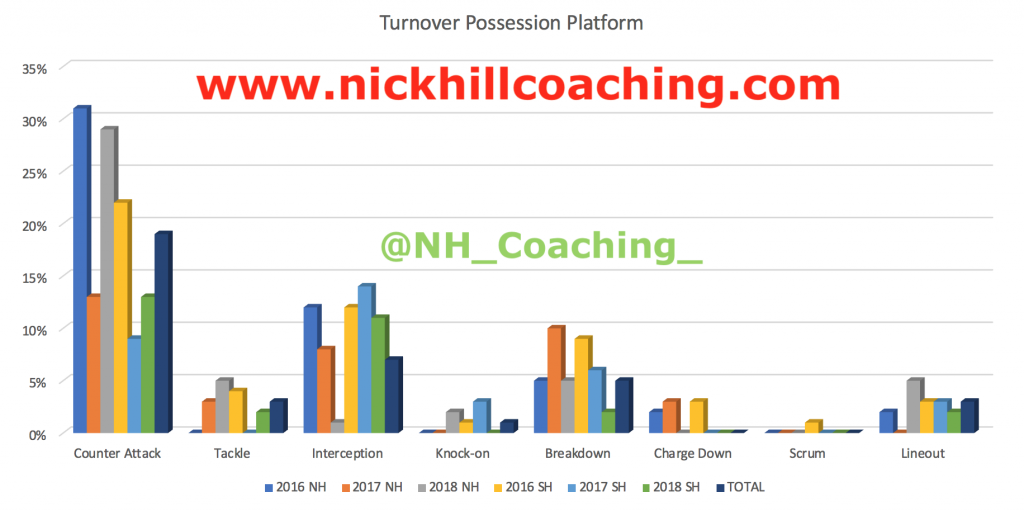
The data shows that the Northern Hemisphere score more tries from Counter Attacks and the Southern Hemisphere scored more tries from Interceptions. Overall, 19% of tries are scored from Counter Attacks and there is a difference in trends between the hemispheres.
Number of Rucks per Try
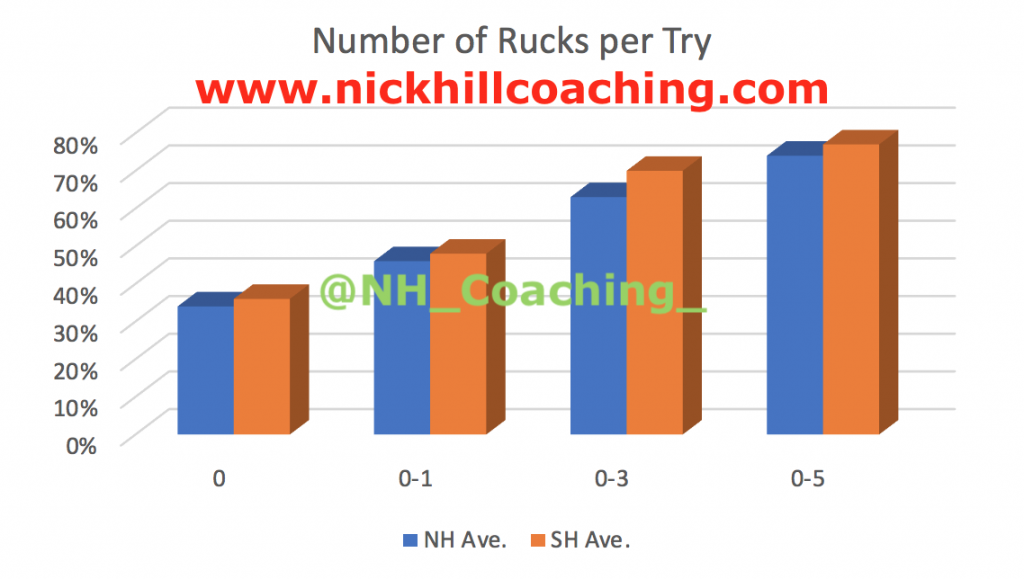
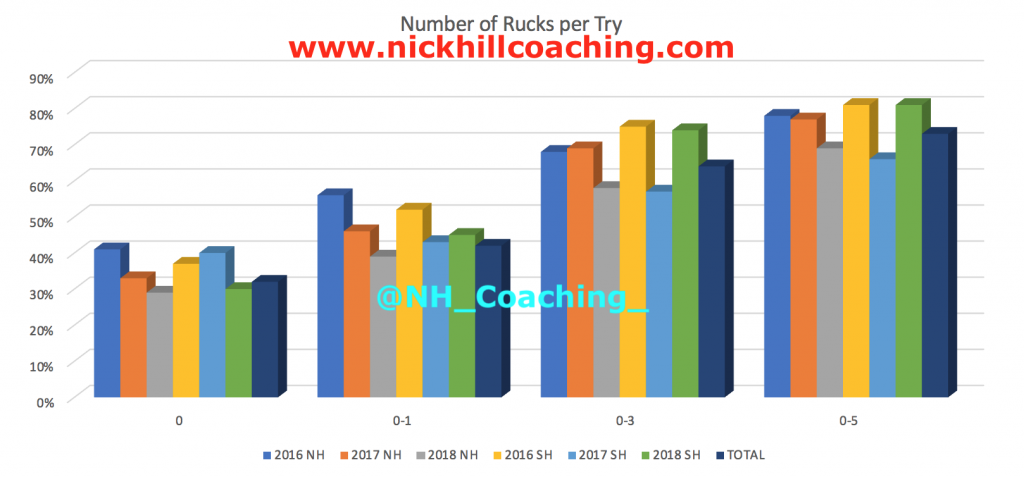
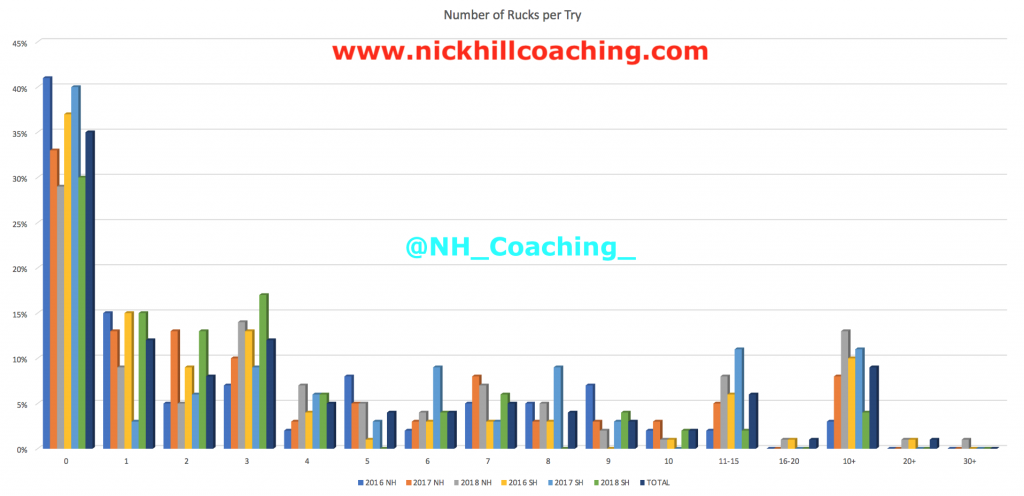
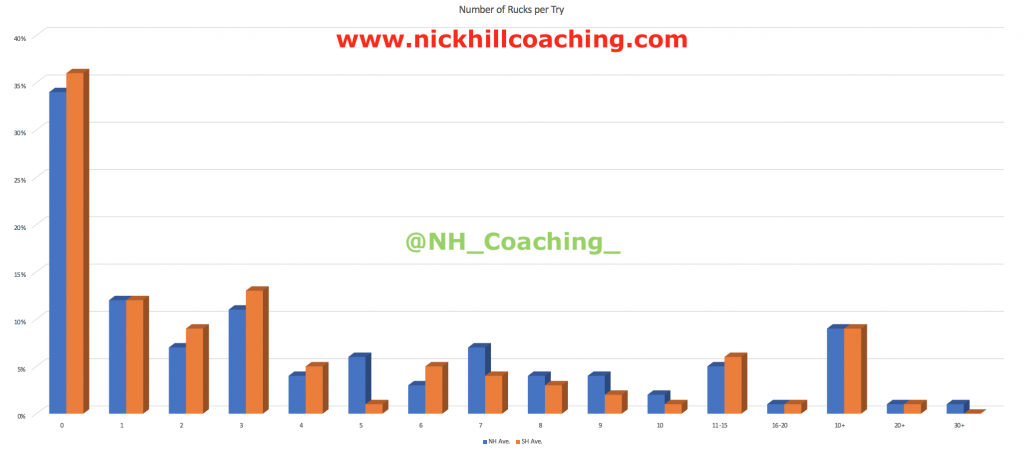
The data shows that the Southern Hemisphere score more tries in less Rucks. The SH average 3.2 Rucks per Try and the NH average 3.6 Rucks per Try. So if you round up and down to the nearest whole number, this means that the SH takes one less Ruck per Try to score. The biggest difference is at 0-3 Rucks where the SH has 70% of tries and the NH 63% of tries. Overall though, there is no real difference in trends between the Hemispheres.
Another interesting fact is that 75% of tries are scored with 5 Rucks or less and 33% of tries are scored with 0 Rucks. Thus a significant counter argument to the commentators and pundits who say that you should build the phases to score tries. This puts this myth to bed.
Number of Rucks per Try per Possession Platform
| Number of Rucks per Possession Platform | ||
| Hemisphere | NH KO Ave. | SH KO Ave. |
| Lineout | 3.1 | 3.8 |
| Scrum | 3.3 | 2.4 |
| Tap Penalty | 1.9 | 2.3 |
| Free Kick | – | – |
| Turnover | 4.2 | 3.1 |
Number of Rucks per Try per Turnover Possession Platform
| No. of Rucks per T/O Possession Platform | ||
| Hemisphere | NH KO Ave. | SH KO Ave. |
| Counter Attack | 5.4 | 3.3 |
| Tackle | 3.2 | 7.75 |
| Interception | 0.5 | 2.4 |
| Knock-on | 2.5 | 0.0 |
| Breakdown | 4.1 | 2.1 |
| Charge Down | 0.0 | – |
| Scrum | – | – |
| Lineout | 4.8 | 5.5 |
Number of Passes per Try
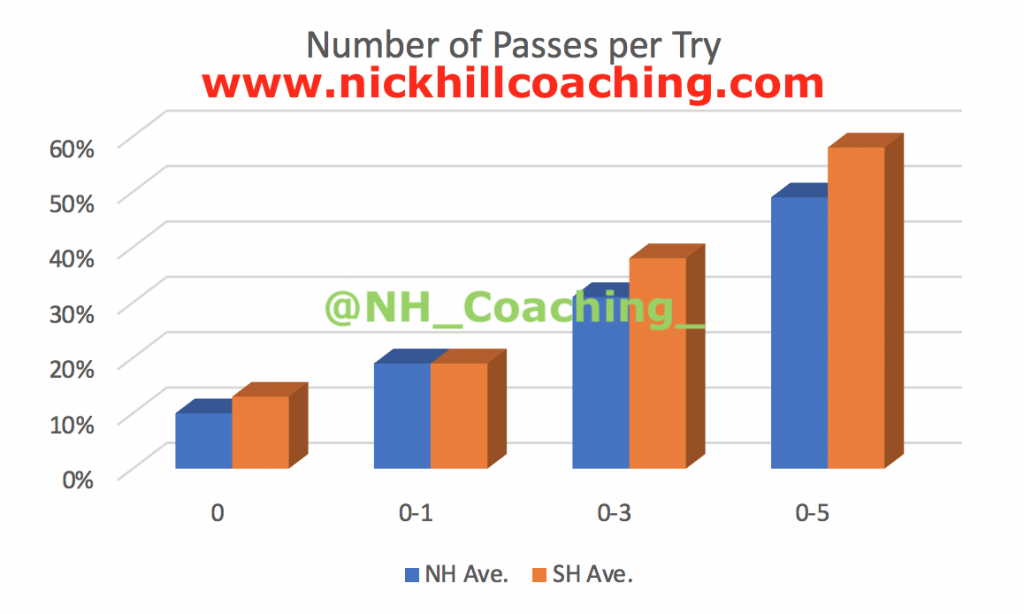
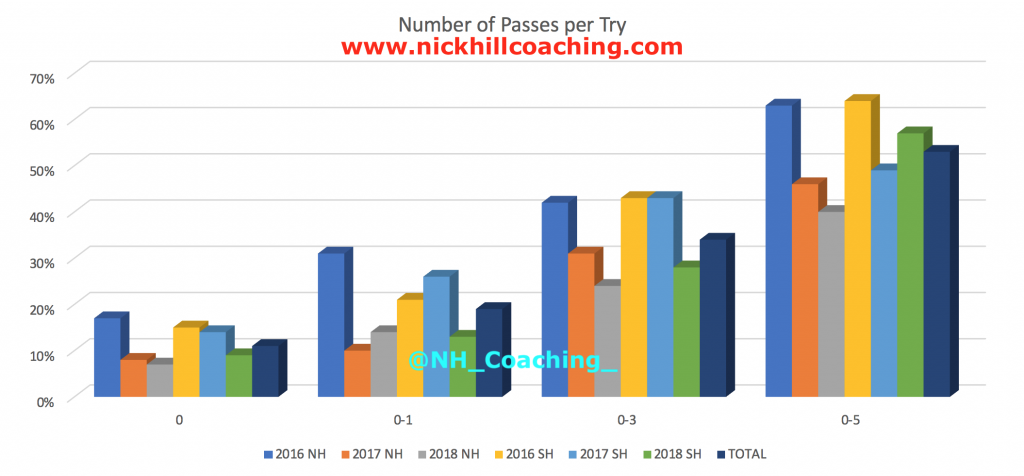
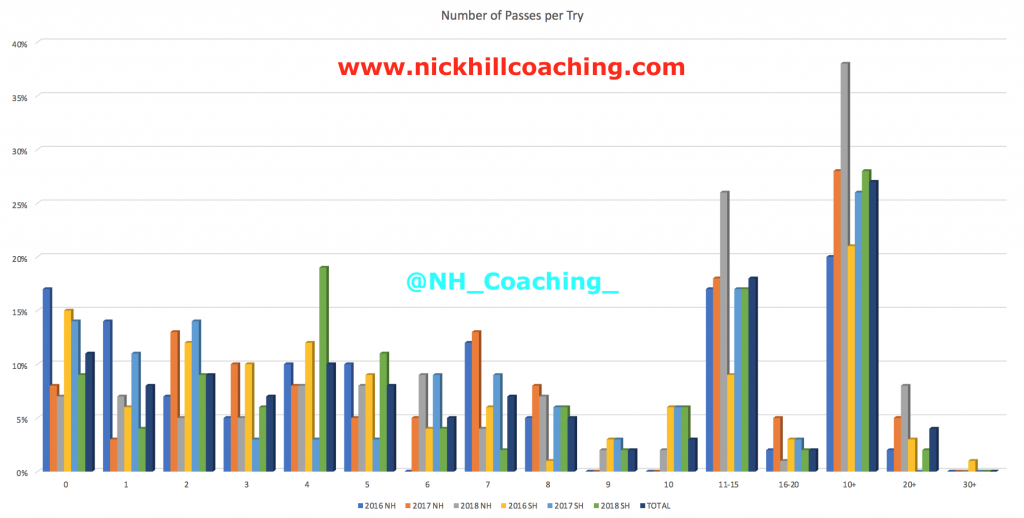
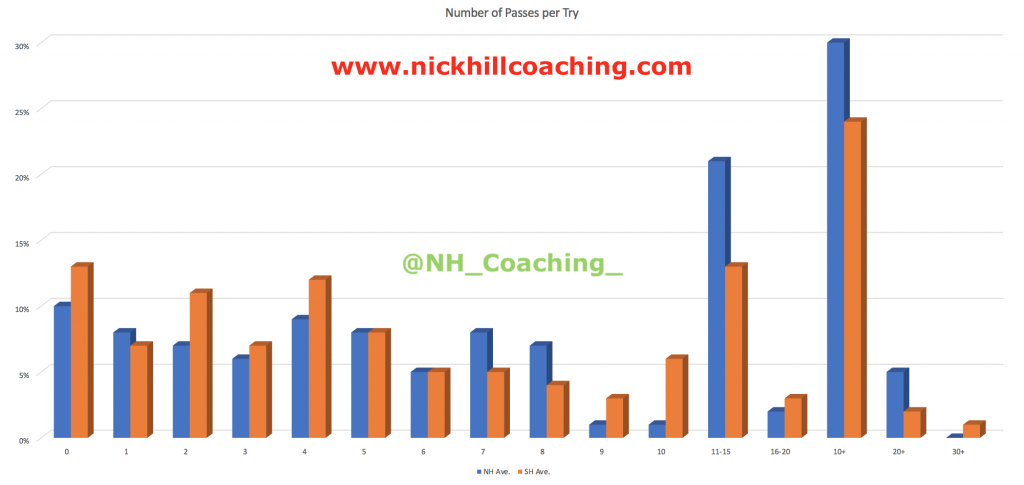
The data shows that the Southern Hemisphere score more tries in less Passes. The SH average 6.0 Passes per Try and the NH average 7.2 Passes per Try, thus the SH take one less Pass per Try to score. The biggest difference is at 0-5 Passes where the SH has 58% of tries and the NH 49% of tries and there is a big difference at 0-3 Passes as well, where the SH has 38% of tries and the NH 31% of tries. Overall though, there is no real difference between the trends of the two Hemispheres.
At 10 or more Passes per Try, the NH has 30% of tries compared to 24% for the SH. At 11-15 Passes per Try, the NH has 21% compared to 13% for the SH further prop that the Northern Hemisphere make more passes to score a try.
Number of Passes per Try per Possession Platform
| No. of Passes per Possession Platform | ||
| Hemisphere | NH KO Ave. | SH KO Ave. |
| Lineout | 7.4 | 6.8 |
| Scrum | 5.9 | 4.5 |
| Tap Penalty | 3.0 | 4.9 |
| Free Kick | – | – |
| Turnover | 8.0 | 6.0 |
Number of Passes per Try per Turnover Possession Platform
| No. of Passes per T/O Possession Platform | ||
| Hemisphere | NH KO Ave. | SH KO Ave. |
| Counter Attack | 9.9 | 7.4 |
| Tackle | 5.0 | 10.5 |
| Interception | 1.3 | 3.4 |
| Knock-on | 4.0 | 0.0 |
| Breakdown | 10.5 | 5.7 |
| Charge Down | 0.0 | – |
| Scrum | – | – |
| Lineout | 6.6 | 11.0 |
Number of Passes per Scoring Phase per Try
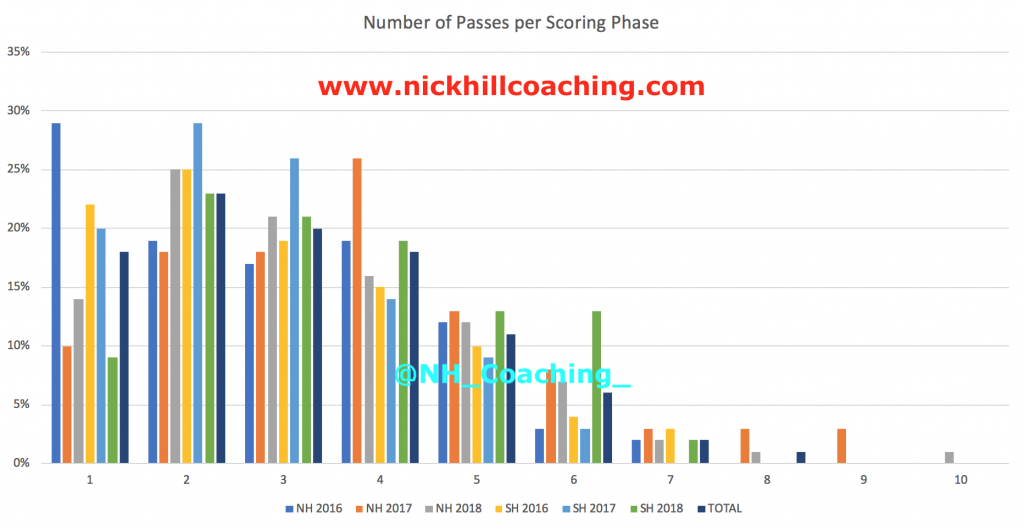
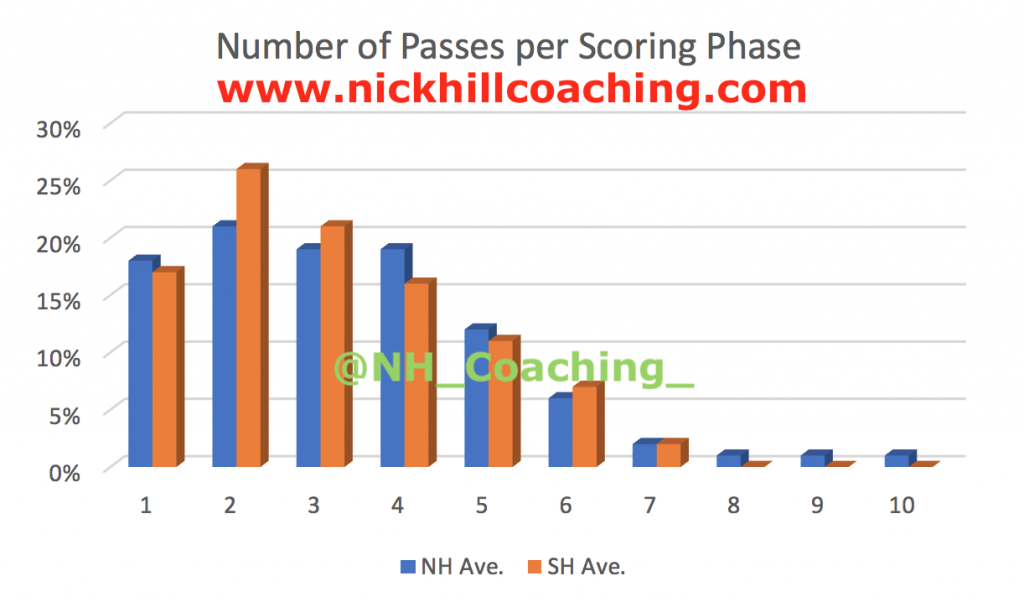
The data shows that the trends for both Hemispheres are very similar with all scoring phases basically being completed with no more than 5 passes, with 90% of tries having 4 passes or less.
Principles of Attack
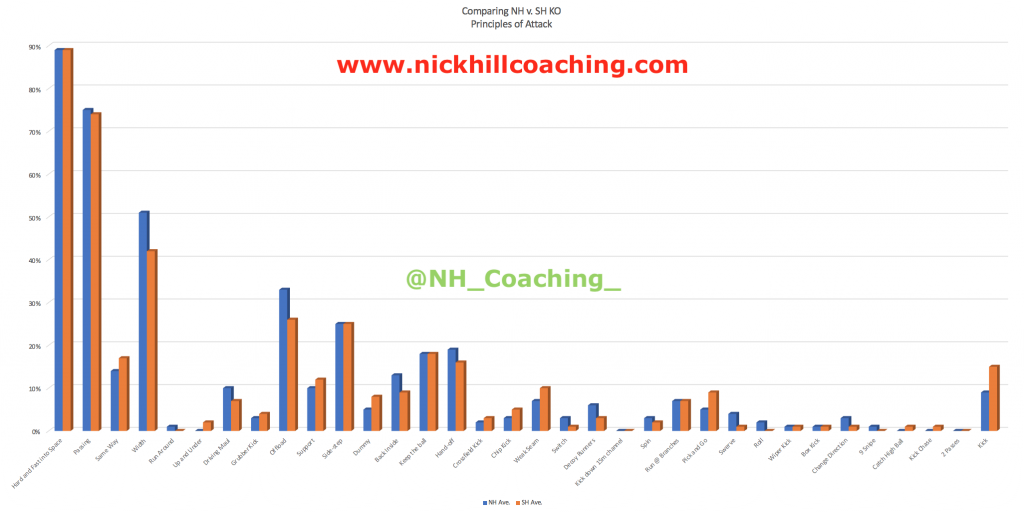
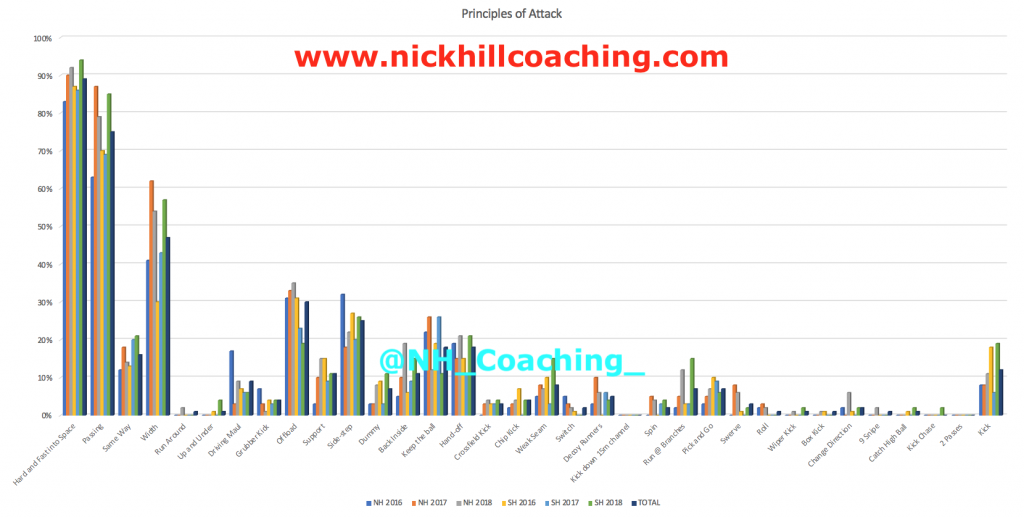
Overall there are very similar trends between both Hemispheres, with the key overall Principles of Attack being ‘Hard and Fast into Space’, use Passing, have Width, Offload, Side-step, and Hand-off.
The data shows there are differences for the SH in…
- Same Way
- Support
- Dummy
- Weak Seam
- Pick and Go
- Kick
The data shows there are differences for the NH in…
- Width
- Driving Maul
- Offload
- Back Inside
- Hand-off
Principles of Defence
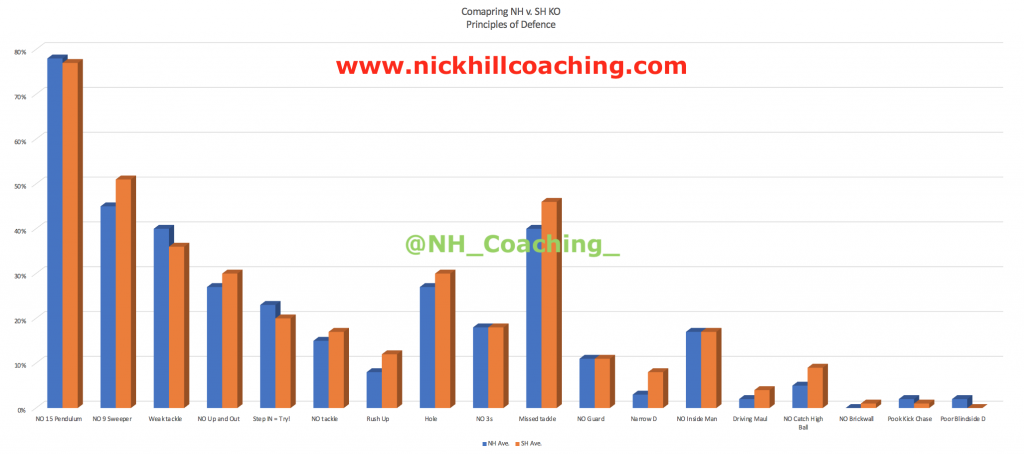
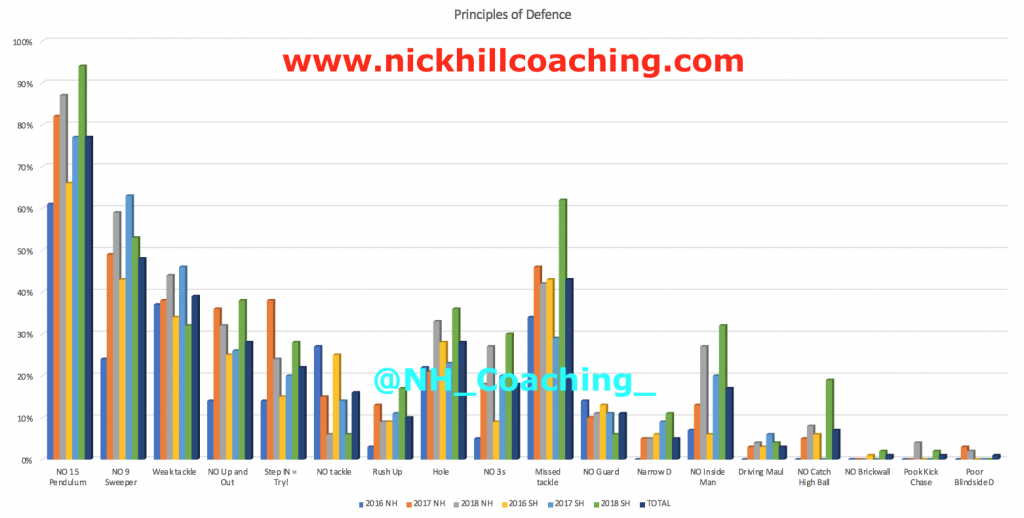
Overall there are very similar trends between both Hemispheres, with the key overall Principles of Defence being ‘NO Back 3 Pendulum, ‘NO 9 Sweeper’, Missed tackle, Weak tackle, ‘NO Up and Out’, ‘Step IN = Try!’, having a Hole in the Brickwall, ‘NO Working in 3s’, ‘NO Inside Man’, ’NO Guard’ at the Breakdown.
The data shows there are differences for the SH in…
- NO 9 Sweeper
- NO Up and Out
- NO tackle
- Rush Up
- Hole in the Brickwall
- Missed tackles
- Narrow D
- Driving Maul
The data shows there are differences for the NH in…
- NO Back 3 Pendulum
- Weak tackles
- STEP IN = Try!
Conclusion
| Try Scoring Trend | Is there a significant difference between the Hemispheres…?! |
| Area of the Field | NO |
| Possession Platform | NO |
| T/O Possession Platform | YES |
| Number of Rucks | YES |
| Number of Rucks per Possession Platform | YES |
| No. of Rucks per T/O Possession Platform | YES |
| Number of Passes | YES |
| No. of Passes per Possession Platform | YES |
| No. of Passes per T/O Possession Platform | YES |
| No. of Passes per Scoring Phase | YES |
| Principles of Attack | NO |
| Principles of Defence | NO |
So looking at the table above, in general there is not really a difference between the Hemispheres in relation to where tries are scored on the field from, the Possession Platform where the try is started from, the Principles of Attack that score the tries and the Principles of Defence that concede the tries.
But where there is a difference between the Hemispheres, it is in relation to the Number of Rucks and the Number of Passes it takes to score a try.
Is there a significant difference between the Hemispheres…?! YES AND NO
Thoughts…
Zooming out and looking across the different pieces of objective data, the observations and conclusions offer more questions than answers. The fact that 4 factors (Area of Field, Possession Platform, Principles of Attack and Principles of Defence) are basically the same falls in line with the fact, for me, that the game is based on principles as Rugby Union falls under the guidance of an Invasion Game, which comes under the Teaching Games for Understanding umbrella.
There’s a few other pieces of information that we should look at as well as I believe that they do share more light into the differences between the Hemispheres.
Overall Average Number of Tries per Match
| Hemisphere | Tries | Matches | Tries per Match |
| Northern | 184 | 43 | 4.3 |
| Southern | 149 | 25 | 6.0 |
Overall Average Number of Points per Match
| Hemisphere | Points | Matches | Points per Match |
| Northern | 1968 | 43 | 45.8 |
| Southern | 1254 | 25 | 50.2 |
Overall Correlation between scoring tries and winning the match
| Hemisphere | +ve | Zero | -ve |
| Northern | 49% | 40% | 12% |
| Southern | 88% | 12% | 0% |
The SH score more tries per match, basically 2 more per match, than the NH which sees their matches have more points per match as well.
The more interesting, and fascinating, objective data is the correlation between the try difference and whether or not you win the game.
- +ve = Scored more tries than the opposition and won the game
- Zero = Scored the same number of tries as the opposition and won the game
- -ve = Scored less tries than the opposition and won the game
As you can see, this objective data clearly shows there is a difference between the Hemispheres. With the +ve correlation there is a 39% difference between them and in favour of the SH where 88% of their matches sees the winning team score more tries than the opposition.
With the -ve correlation, for the SH that is 0% and the NH is 12%. For me this shows the reliance in the NH of kicking for goal with penalties to win a game, where teams slowly build up the scoreboard which comes from more penalties being awarded at scrums and breakdowns because of the traditional dominance of set piece play and the way players clear breakdowns by just smashing the opposition and charging off their feet within the NH. This, I believe, is due to the reliance on picking players who are very big to play this set piece game rather than picking players based on their skills. The way the game is refereed may also play its part in this difference, but I can say for certain as I don’t have the objective data comparing what referees award penalties for in either Hemisphere.
This objective data highlights what the objective of the game of the Rugby Union is about, when looking through the lens of it being an Invasion Game, scoring tries in attack and stopping tries in defence. And if you do that then you will win the game.
NB
This is a relatively small sample of tries from my research and only includes Clubs, but it does shed some light into the similarities and differences between the Hemispheres.
As part of my overall ongoing Try Scoring Trends Research Project, I tracked all matches at the 2015 Rugby World Cup and I am tracking the Northern Hemisphere’s 6 Nations Tournament and the Southern Hemisphere’s The Rugby Championship with data so far from 2013 to 2019, so I have a larger comparison set of data between Nations.
For 2015 to 2019 I have a comprehensive analysis of tries from Super Rugby and a significant analysis from the European Champions Cup, the English Premiership, the PRO 14 and France’s TOP 14 adding a much larger sample size of tries for the comparison between Clubs.
So in the future I’ll have a much larger data set to add weight to the debate between the Hemispheres, and come to a more conclusive answer as to whether there actually is a difference between the Hemispheres, or it is in actual fact just a myth that has taken a “Path of Dependence”.